Restaurant Analytics Software India — AI Business Reports, Sales Dashboard & 7-Day Revenue Forecasting
Restaurant analytics software turns raw sales data into dashboards and reports that show owners how the business is actually performing. FrontPe gives real-time sales dashboards, AI-generated daily reports at 6 AM, 7-day revenue forecasting, and menu performance analytics — no manual reporting needed.
Real-Time Executive Dashboard — Live KPIs at a Glance
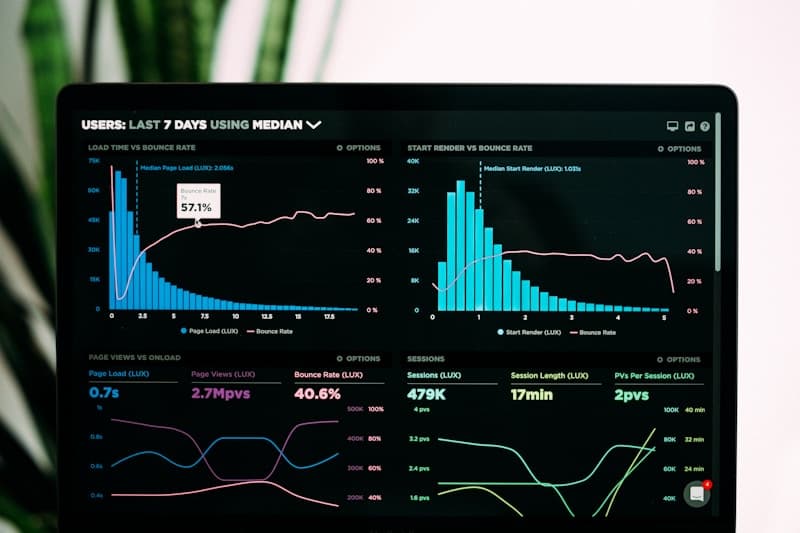
FrontPe's executive dashboard gives you a live view of your restaurant's performance — revenue, orders, average order value, payment method breakdown, and growth scores — updated in real time. Access it from any device, anywhere.
Live revenue and order count
Average order value tracking
Payment method breakdown (UPI, card, cash)
Revenue vs yesterday comparison with % change
Business health scores (0–100) for 5 areas
Accessible from any device, anywhere
AI-Generated Daily Business Reports — Delivered at 6 AM
FrontPe's AI business advisor generates a comprehensive daily report at 6 AM for every active restaurant. No manual analysis required — the AI identifies trends, flags issues, and suggests prioritised actions so you start every day informed.
7-Day Sales Forecasting — Plan Ahead with Confidence
FrontPe's AI forecasts your revenue for the next 7 days based on historical patterns, day-of-week trends, and seasonal factors. Use the forecast to plan staffing levels, ingredient purchasing, and promotional campaigns.
7-day revenue forecast with confidence levels
Day-of-week pattern analysis
Seasonal trend detection
Forecast vs actual comparison
Staffing and inventory planning guidance
Menu Performance & Customer Analytics
Understand which menu items drive the most revenue, which are underperforming, and which customers are your most valuable. FrontPe analytics covers menu performance, customer lifetime value, repeat visit rates, and new customer growth.
Top-selling items by revenue and quantity
Least-selling items for menu optimisation
Customer new vs repeat breakdown
Customer lifetime value tracking
Category-level revenue analysis
Peak hour and day-of-week heatmap
What this changes for the owner
Get a complete business report every morning without manual work
Identify your top and least-selling items to optimise the menu
Know your peak hours to plan staffing and inventory correctly
Forecast revenue 7 days ahead with AI-powered predictions
Track business health scores across 5 key areas
Compare branch performance to identify best practices
Monitor new vs repeat customer growth trends
Make data-driven decisions instead of guessing
Who uses this
Restaurants
Restaurant owners use FrontPe analytics to track daily revenue, identify peak hours, and make data-driven decisions on staffing and menu.
Cafes
Cafe owners use FrontPe AI reports to understand which drinks and food items drive the most revenue and when their busiest hours are.
Cloud Kitchens
Cloud kitchen operators use FrontPe analytics to track order volume by hour, identify top-performing dishes, and forecast demand for ingredient planning.
Food Chains
Multi-outlet food chains use FrontPe to compare branch performance, identify underperforming locations, and replicate success across the chain.
Franchises
Franchise operators use FrontPe analytics to monitor franchise performance, enforce standards, and identify franchisees that need support.
Questions we get asked
Does FrontPe generate reports automatically?
Yes. FrontPe's AI business advisor generates a daily report at 6 AM automatically for every active restaurant. No manual report generation is needed.
What does the AI daily business report include?
The AI report includes revenue trend vs yesterday, top and least-selling items, low stock alerts, peak hour identification, customer growth (new vs repeat), and actionable recommendations with priority levels.
How does the 7-day sales forecast work?
FrontPe's AI analyses your historical sales patterns, day-of-week trends, and seasonal factors to forecast revenue for the next 7 days with a confidence level for each day.
Can I see analytics for multiple branches?
Yes. The FrontPe executive dashboard shows consolidated analytics across all branches. You can also drill down to individual branch performance for comparison.
What are business health scores?
FrontPe calculates 5 business health scores (0–100) for Revenue, Operations, Customers, Inventory, and Kitchen. These give you a quick snapshot of how each area of your restaurant is performing.
Can I export sales reports?
Yes. FrontPe allows you to export daily, weekly, and monthly sales reports in formats suitable for your accountant or business review.
Run your next shift on FrontPe.
Works on the tablets and phones you already have. No proprietary hardware.